GrafanaCubism-Panel v0.0.4
cubism, grafana ·I’ve been quite busy over the past month working on a new release of my cubism plugin for Grafana, called grafanacubism-panel. It’s been an exciting journey of improvements and revisions!
It’s still not signed as both version 0.0.2 and 0.0.3 had issues that were picked by the review process (0.0.1 was somewhat of a trial balloon as it was not uploadable to Grafana for a review).
I’m somewhat hopeful that this version should be approved.
I’ve made significant updates to the underlying library, cubism-es, including:
- Stopping assumptions about element presence to enhance stability.
- Introducing configurable CSS classes for reduced namespace pollution.
In addition to a significant overhaul of the underlying library, I dedicated time to address key issues related to data point extrapolation in cubism. It relies on having exactly one data point per pixel, creating a challenge when the data source provides more or fewer data points than necessary.
Previous Approach to Extrapolation and Resampling
Previously, the plugin’s logic for handling data points was rather straightforward: if the source provided more data points than needed, we averaged multiple data points to align with the required number. Conversely, if there were gaps in the data, missing points were filled in by either taking the next available value or using the previous one.
However, this approach had its downsides:
- Minor visual glitches could occur when a few data points were missing from an otherwise well-populated dataset.
- In cases where there were only a handful of data points, these points would be stretched to cover the entire graph, potentially misleading viewers.
Introducing a New Extrapolation and Resampling Strategy
The updated logic now considers the smallest interval between data points and their 99th percentile interval. If the spread between points is more than tripled, we opt not to use extrapolation due to a significant number of missing points.
For resampling, we now calculate the average of data points within the range of the previous and current timestamps being displayed. If no data points fall within this range, we reuse the previous value to fill the gap, ensuring at most one missing data point is interpolated.
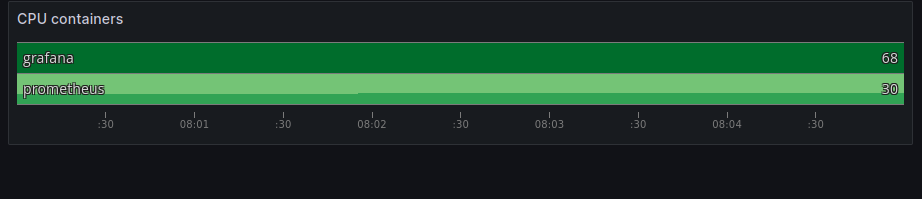
When extrapolation is selected, missing values are filled by looking at the next and, if necessary, the previous data point. It might feel that it’s wrong after all we (I) are inventing datapoints, on one hand this is true if you have a graph where every pixel represents a 2 seconds interval and you have datapoints every 15s you are inventing/creating datapoints but they are somewhat tethered to the reality; if you measured the value for this given timestamp the result would be somewhat similar to what has been extrapolated and also it make the graph much more readable.
Let’s have a look at how a cubism would look when zooming on 5 minutes interval:
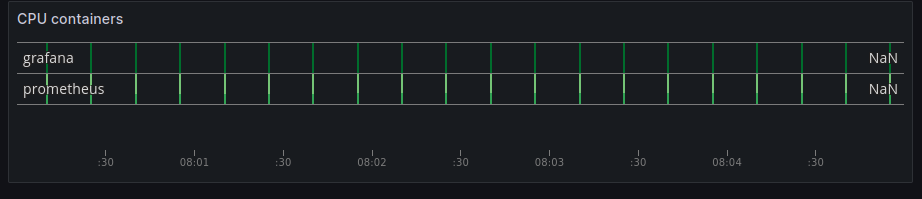
Here, each pixel on the graph represents approximately 0.338 seconds due to a 5-minute interval. With Prometheus data points arriving every 15 seconds, there’s a noticeable gap of approximately 45 pixels between each data point, resulting in a less-than-optimal viewing experience.
If you have any feedback or suggestions, or simply want to show your support, feel free to buy me a coffee.